Now is not the time for panic selling
Australia’s sharemarket is down more than 30% from its peak in February. Many investors are understandably left wondering whether they should stay in the markets or go to cash or something less risky. Some of your friends may be suggesting this or perhaps you heard it on the grapevine that this may be a good idea.
We have outlined below our view and the empirical investment research informed by past corrections as well as the latest view from well-respected investment consultancy InvestSense – our investment research, portfolio construction and asset allocation partners.
Prior to the COVID-19 outbreak, markets had experienced one of the longest bull markets in history. Now many investors are left wondering where to next as we face an unprecedented moment in recent history.
The emotions we feel when markets are behaving like they are at the moment are completely normal and you can be forgiven for thinking investment markets are not for you or that you will be happy just having your money in the bank.
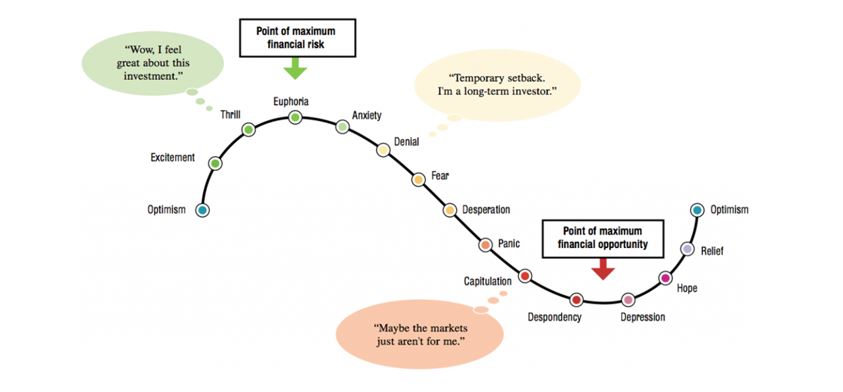
The cycle of market emotions graph below has been around for decades and through many market cycles. It simply explains how we are all feeling at different times of the market cycle, both when things are going well and when things are not, as we find ourselves in this period.
As you can see below, when we are feeling the emotion of “Capitulation” (selling and going to cash), this is nearing the bottom of the cycle and in many ways is the wrong time to sell, as it is the “point of maximum financial opportunity”.
At Wealth Connexion, we are very aware of the market cycles and consequently, our recommended portfolios have been well-diversified. Due to our disciplined risk mitigation mindset and strategy, we had recommended our clients have less of their money exposed to expensive shares than many other super funds and investment portfolios. We also recommended significant allocations to cash and other non-share investments in the portfolio which we will look to deploy into the portfolio as we get closer to the bottom of the cycle – “the point of maximum financial opportunity”.
Generally, after share markets have had a large selloff, they tend to rebound quite strongly, this is why selling out of shares and moving into cash near the bottom of the cycle can be the worst action to take, especially when money in the bank is not even keeping up with inflation, in reality, the value of your money is going backwards.
We have also provided for your reference below analysis provided by Morningstar, another well respected investment research house that have shown the differing impact of “staying invested”, “going to cash and statying there” and “going to cash and attempting to get back into the market – 1 year later”. This is just one illustration of much analyses that demonstrate that “staying invested” as part of a well crafted, heavily diversified portfolio with adequate orienation to defensive assets is the preferred strategy to preserve your wealth.
Investors who attempt to time the market run the risk of missing periods of exceptional returns, leading to significant adverse effects on the long term growth of the portfolio.
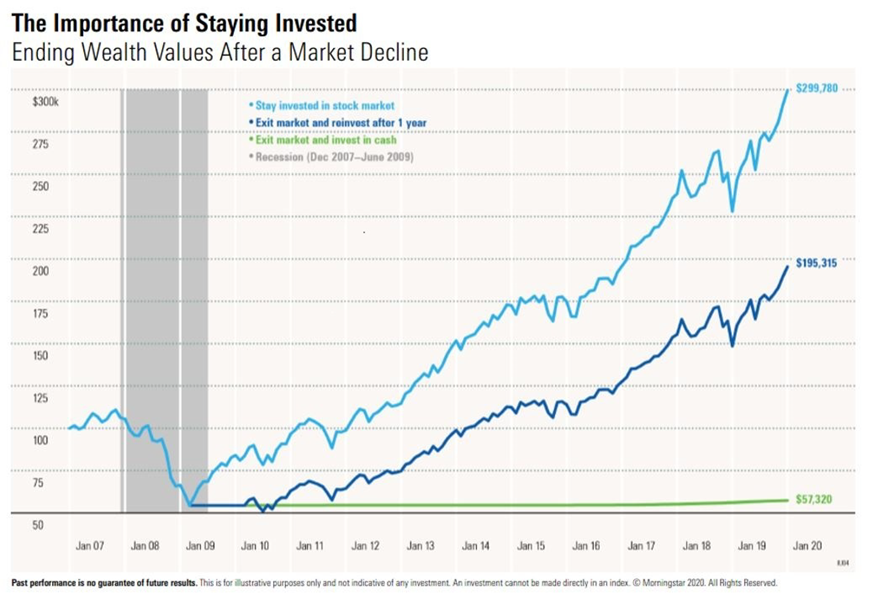
The image above illustrates the value of a US$100,000 investment in the stock market during the 2007–19 period, which included the global financial crisis and the recovery that followed. The value of the investment dropped to US$54,381 by February 2009 (the trough date), following a severe market decline. If an investor remained invested in the stock market over the next ten years, however, the ending value of the investment would have been US$299,780. If the same investor exited the market at the bottom, invested in cash for a year, and then reinvested in the market, the ending value of the investment would have been US$195,315. An all-cash investment at the bottom of the market would have yielded only US$57,320. The continuous stock market investment recovered its initial value over the next three years and provided a higher ending value than the other two strategies.
While all recoveries may not yield the same results, investors are well advised to stick with a long-term approach to investing.
About the data
Research and analyses provided by Morningstar “Downturns and Recoveries” 20th March 2020. Recession data is from the National Bureau of Economic Research. The market is represented by the Ibbotson® Large Company Stock Index. Cash is represented by the 30-day U.S. Treasury bill. An investment cannot be made directly in an index. The data assumes reinvestment of income and does not account for taxes or transaction costs.